Maps from the Paleolithic era are changing our view of history. In France, at Ségognole 3, a 13,000-year-old rock shelter, archaeologists found a 3D map carved into sandstone. This map is 10,000 years old, making it the oldest known map ever found.
It shows early humans could map water flows and landscapes with great accuracy. These maps show how ancient societies navigated their environments using only what they saw and remembered.
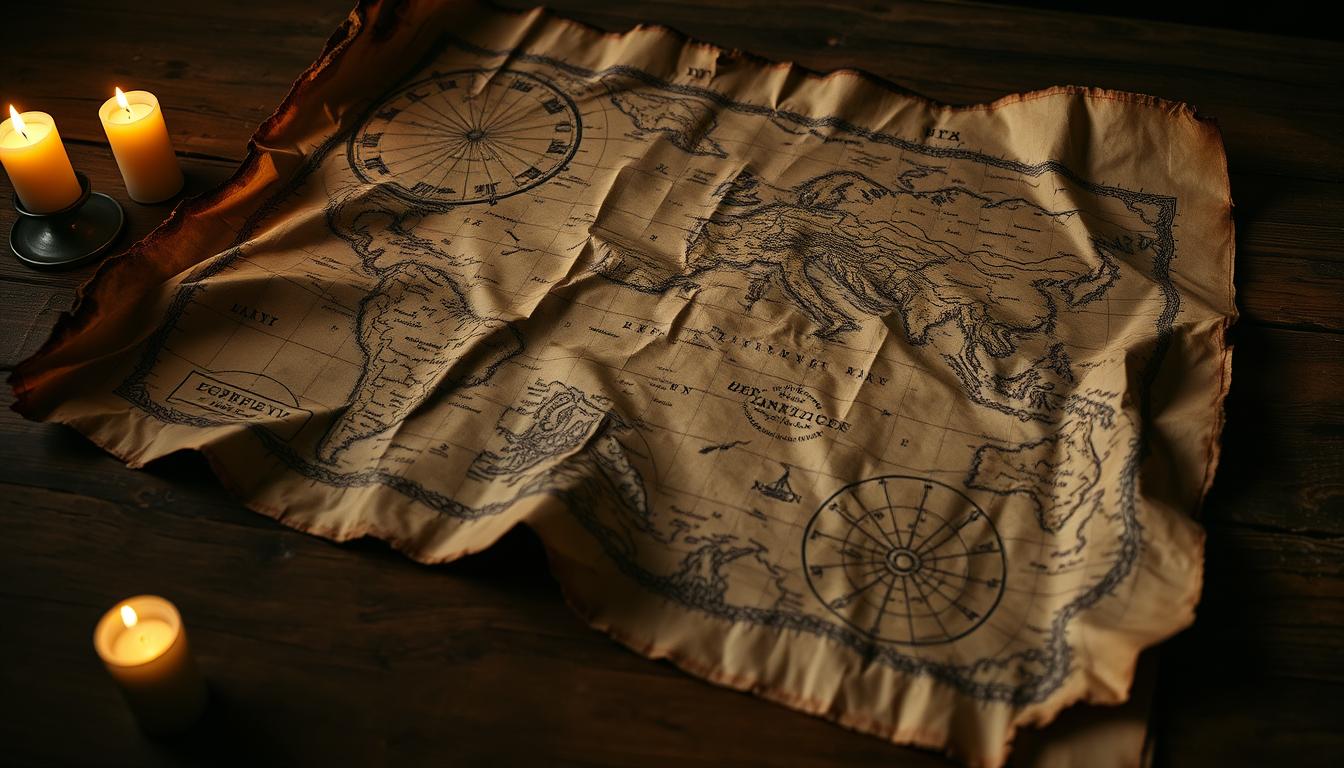
Maps like the Babylonian world map (6th century BCE) mixed reality with myth. It was carved in clay and showed the Euphrates and Tigris rivers alongside mythical creatures. This map combined trade routes with spiritual beliefs.
Such discoveries show maps were more than just tools for navigation. They also carried cultural values and marked territorial claims. Even the Tabula Rogeriana (1154 CE) was surprisingly accurate, showing ancient engineers knew a lot about math and astronomy.
Mapping history shows our eternal desire to understand the world. From ancient inscriptions to medieval maps, these finds challenge our views of early civilizations. New discoveries like Ségognole 3’s 3D carvings make us rethink how humans thought and worked together in the past.
Introduction to Ancient Cartography
Humans have been mapping their world for thousands of years. The history of cartography started with survival and curiosity. Prehistoric maps appeared long before writing, like the 25,000-year-old mammoth tusk etchings or 14,500 BC star patterns in Lascaux caves.
These early sketches helped guide hunting routes or track celestial events. They show how map evolution began in our ancestors’ need to navigate and explain existence.
Ancient map-making techniques varied around the world. Aboriginal Australians used ochre on bark, while Mesopotamians inscribed clay tablets. The Ségognole 3 rock shelter in France, dating to 12,000 BC, shows early three-dimensional terrain depictions.
Early cartographers like Anaximander (600 BC) later sketched Mediterranean coastlines, blending science with myth. Babylonians created symbolic world maps, like the 600 BC clay tablet showing a circular Earth surrounded by water.
These ancient map-making techniques evolved from survival tools into cultural artifacts. The Saint-Bélec slab (2200–1600 BC) mapped land divisions in Brittany, hinting at administrative uses. Each era’s innovations—from Babylonian city plans to Ptolemy’s coordinate systems—reflect humanity’s expanding knowledge.
This progression shows how cartography mirrored societal growth. It merged artistry and science to map both land and imagination.
The Oldest Known Maps
Exploring the earliest maps in history, we find clues to our first attempts at understanding space. The oldest map, carved on a mammoth tusk around 25,000 BCE, was found in Mezhirich, Ukraine. This ancient map shows hills and rivers, a simple yet clear way to represent the terrain.
Such finds change how we see the early days of cartography. They show that long before writing, humans were documenting their world.

Cave paintings also show surprising complexity. In Lascaux, France, 17,000-year-old paintings match constellations like Taurus. This suggests ancient people mapped the sky.
The Çatalhöyük wall painting (6200 BCE) in Turkey shows a settlement and a volcano. It hints at early urban planning. These images were more than art; they were tools to record landscapes and events.
Stone age maps like the Abauntz Cave in Spain (14,000 BCE) map mountains and hunting paths. After 15 years of study, Pilar Utrilla’s team decoded it. It challenges old ideas about prehistoric intelligence.
The Bedolina map (1000 BCE) in Italy’s Alps details roads and fields. It shows early ideas of land ownership.
These discoveries show how ancient people used maps for survival and community. From mammoth tusks to cave walls, mapping was a universal human drive. Each etching and painting shows a world where space was measured with growing permanence and purpose.
The Babylonian Map of the World
Imagine holding a 12.2 cm clay tablet from 6th century BCE Mesopotamia. The Babylonian world map—also called the Imago Mundi tablet—is a tiny artifact with huge importance. Found in Sippar in 1881, this Sippar clay tablet map has lasted 2,600 years, showing how ancient Mesopotamians saw their world. Today, it’s in the British Museum, with Babylon at its center, surrounded by the Euphrates River and a ring called the “Bitter River,” representing the cosmic ocean.
The map’s design shows ancient Mesopotamian cartography mixing fact and myth. It features seven cities, including Urartu and Assyria, and eight triangular regions beyond the Bitter River, suggesting unknown lands. The text talks about regions of eternal light and darkness and a “great wall” blocking the sun. It also names kings like Sargon, linking geography to Babylonian legends.
Created around 600 BCE, this 6th century BCE map was more than a tool—it was a statement about the cosmos. Scholars like Dr. Irving Finkel say it shows early attempts to map both space and meaning. With 11 lines of text and 29 on the reverse, it offers a rare look into a civilization’s view of the world, showing ancient mapmakers tried to explain Earth and the divine.
The Ptolemaic World Map
Claudius Ptolemy’s Geographia maps changed ancient Greek cartography, mixing math and myth. Written in Alexandria around 150 AD, it mapped 8,000 places with coordinates. Sadly, the original Claudius Ptolemy map is lost, forcing scholars to recreate it.
The first attempts to recreate the map started in 1295. Byzantine monk Maximos Planudes found the text and made maps from it. He called it a “new window to the ancient world.”
“The earth’s shape, once hidden, now unfolds through numbers and ink,” Planudes wrote in his celebratory verses.
Despite its mistakes, the Ptolemaic world view was key for centuries. Ptolemy made Asia too big and the Earth’s circumference too small. His maps showed the Indian Ocean as a closed sea, with Ceylon and China wrongfully split.
Yet, his work didn’t fade away. Roman traders used his maps to sail the Indian Ocean. Silk Road routes also followed his coordinates. Even though explorers like Columbus later found his errors, Ptolemy’s grid-based mapping method is a cartography cornerstone.
His work linked ancient and modern cartography. It shows how ancient Greek maps influenced Renaissance discoveries.
The Tabula Rogeriana
The Tabula Rogeriana was a groundbreaking map at the meeting point of Islamic and Norman cultures. It was made by Muhammad al-Idrisi for King Roger II of Sicily in the 12th century. This map combined Islamic cartography and Norman-Arab geography.
It took 15 years to complete in 1154. The Book of Roger text and 70 regional maps made it a pioneering atlas.
Al-Idrisi’s map was a game-changer. The original was on a 6-foot-wide silver disc, weighing 450 pounds. Only copies remain today.
The map was oriented southward, following Islamic tradition. It showed the world with remarkable accuracy. Al-Idrisi estimated Earth’s circumference as 37,000 km, close to the real value.
His 70 maps divided the Northern Hemisphere into seven zones. Each zone was further divided, using data from travelers and ancient texts.
The Al-Idrisi map’s impact is seen in 10 surviving manuscripts. The oldest is in Paris’ Bibliothèque Nationale, from 1325. The most complete version is in Istanbul.
Its Islamic cartography methods were ahead of Europe’s symbolic maps. This map showed that geography was a global pursuit, not just for Europeans.
Translations into many languages spread its fame. It remained the most accurate world map until the 15th century. This highlights how knowledge flourished at medieval crossroads, connecting East and West through science and curiosity.
Exploring the Vinland Map
The Vinland Map controversy started when Yale University showed off its 1965 find: a parchment that seemed to show Viking America maps with “Vinland.” This 15th-century map claimed Norse explorers reached North America before Columbus. But, many questioned its authenticity, doubting its role in pre-Columbian American cartography.

Scientific tests revealed oddities. In 1973, Walter McCrone found anatase—a titanium compound made after 1917—in the ink. Later studies confirmed this modern pigment, proving it a medieval forgery. Despite this, debates continued for years. Some pointed out the parchment’s age didn’t match the ink’s, while others believed it supported Norse claims. By 2021, most agreed: the map was a 20th-century fake.
Its impact remains. The forgery highlights a timeless struggle: the allure of exciting historical tales versus the need for solid proof. Though the map itself is a hoax, it sparked more interest in Norse exploration maps. Archaeological discoveries at L’Anse aux Meadows later confirmed Vikings did reach Canada, but not through this map. Today, it teaches the importance of skepticism when examining historical “discoveries.”
The Mappa Mundi of Hereford
The Hereford Cathedral map is the largest medieval world map left today. It’s 5 feet 2 inches tall and 4 feet 4 inches wide. Made in the 14th century, it mixes Christian cartography with myths and scripture.
It was created around 1300 CE. It’s kept in Hereford Cathedral, showing medieval England’s drive for knowledge.
The map uses a T-O maps design, with Jerusalem at the center. Three continents spread out like a cross. It has over 500 ink drawings, showing 420 towns, biblical scenes, and mythical creatures.
The map focuses on religious truths, like medieval English maps did. For example, it shows the Caspian Sea connected to the ocean, a mistake from that time.
Despite its mistakes, the map shows what people thought back then. UNESCO sees it as part of our shared history. Today, you can see its details online thanks to a 2013 3D scan.
This Christian cartography wonder shows how maps once showed a civilization’s soul.
The Ebstorf Map
The Ebstorf Mappa Mundi is a key example of German medieval maps. It was made around 1300 CE at a Benedictine abbey. This 11.7-foot-wide map showed a Christ world map with Christ around the globe. His hands stretched north and south, and his head pointed east, showing divine control. 
This medieval German cartography masterpiece put Jerusalem at the center. It was surrounded by stories like Noah’s Ark and the Tower of Babel. Over 2,000 inscriptions detailed cities, rivers, and theological concepts. Sadly, the original was destroyed in 1943, but photos show its detailed designs.
The map’s circular shape showed medieval beliefs about Earth as a divine blueprint. Unlike practical maps, it focused on spiritual truths. The Ebstof Map was three times larger than the Hereford Mappa Mundi, making it a key teaching tool. Scholars now study its mix of geography and theology, showing medieval thought was not “backward.”
Though lost, its impact lives on in digital archives. Sites like the Antique and Medieval Atlas and David Rumsey Collection share reproductions. The Ebstof Map shows that religious cartography mapped humanity’s place in God’s universe, not just land and seas.
Techniques Used in Ancient Cartography
Ancient map-makers used materials like clay, papyrus, and silk. Babylonians carved designs into clay with styluses. Egyptians used carbon-based inks on papyrus. These ancient map-making materials were paired with historical map drawing tools like brushes and natural pigments. Silk allowed for portable maps in China, blending practicality with culture.
Early surveying methods were simple yet effective. Egyptian surveyors measured land after Nile floods with knotted ropes. They created ancient measurement systems like the stade. Eratosthenes calculated Earth’s size using shadow angles, merging math with observation. Astrolabes later helped track stars for navigation.
The cartographic techniques history shows many approaches. Greek maps focused on their homeland, while Islamic maps faced south. Colors like red for roads or blue for water became universal. These innovations turned local knowledge into global guides, showing how ingenuity solved challenges without modern tech.
How Ancient Maps Influence Modern Mapping
Ancient maps are in every GPS route or digital map. The use of latitude and longitude, started by Ptolemy in 150 CE, is key to modern navigation. These cartographic traditions show how old solutions to mapping problems are in today’s tools.
“A map is a dialogue between reality and the maker’s vision,” noted scholars studying the historical map legacy of ancient Greece and Rome.

Early cartographers had the same challenges we do today. They had to flatten Earth’s curves or choose what details to include. Medieval maps showed religious sites, while modern apps highlight restaurants or traffic. Both show what cultures value.
Even digital maps today go back to Ptolemy’s grid-based idea. Now, we use satellites instead of clay tablets. Symbols like blue for water or peaks as triangles have stayed the same from Babylonian times. GIS systems layer data like ancient Roman maps combined roads and terrain.
The mapping evolution from hand-drawn charts to algorithms shows a continuous thread. Today’s satellite surveys use Eratosthenes’ ancient Earth size calculations.
Old maps taught us to see space as both tool and story. Their legacy is in every app, showing that digital maps have 5,000 years of cartographic traditions behind them.
Conclusion: The Lasting Impact of Ancient Maps
Ancient maps are key to understanding the ancient world. They give us glimpses into cultures and environments that are now lost. The Babylonian clay tablets and Egyptian gold mining charts show early humans’ drive to map their world.
These artifacts’ historical map significance grows as new tech uncovers hidden details. Even mistakes, like Ptolemy’s wrong Earth size, show how cartography and historical knowledge evolved.
Today, we use advanced tech to study ancient maps. Multispectral imaging finds hidden ink on medieval parchments. Satellite data compares ancient river routes to today’s landscapes.
The Peutinger Table, a Roman road map, helps archaeologists find forgotten settlements. Such map archaeological discoveries change how we see trade networks and cultural exchanges. From the Hereford Mappa Mundi’s visions to the Waldseemüller map naming America, these relics show how knowledge cycles.
GIS systems and GPS now blend ancient insights with modern tools. AR and AI might soon uncover even more secrets. The Cantino Planisphere’s New World depiction is like today’s digital maps tracking global changes.
Each discovery, like the Vinland Map’s Viking links, shows history’s stories are ongoing. Ancient cartography’s mix of art and science shows humanity’s endless curiosity. As we use smartphones, we carry forward the quest of ancient scribes and monks.